Overview
Gpuvis is a Linux GPU profiler similar to GPUView on Windows. It is designed to work with trace-cmd captures and help track down Linux gpu and application performance issues.
Pierre-Loup from Valve Software did a brief talk + demo on Gpuvis at XDC 2017:
https://youtu.be/g5T5wSCXkH4?t=29428
A sample trace file is checked into the gpuvis repository. A quick way to play with gpuvis is to Build it and then Run it on that trace:
gpuvis traces/amdgpu_trace.zip
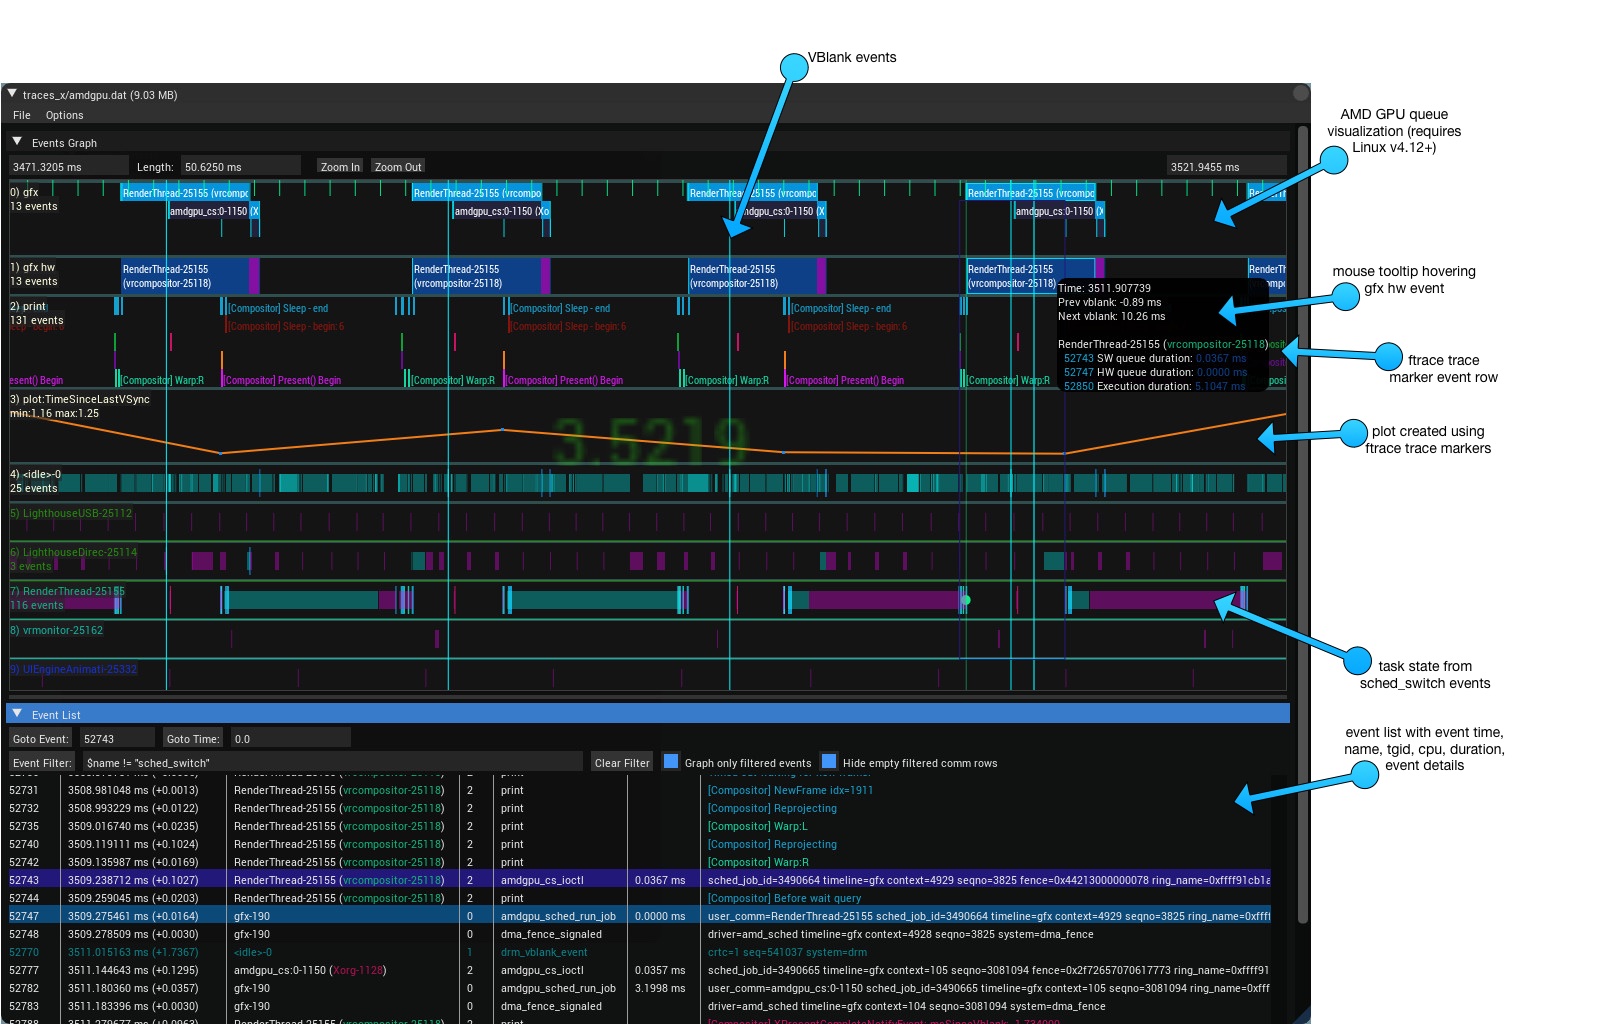
Gpuvis normally displays two panes: Events Graph and Events List. On the graph, you can:
- click+move to pan
- ctrl+click for selected time
- shift+click to zoom selected region
- mousewheel to zoom in/out
- create plots from ftrace marker events
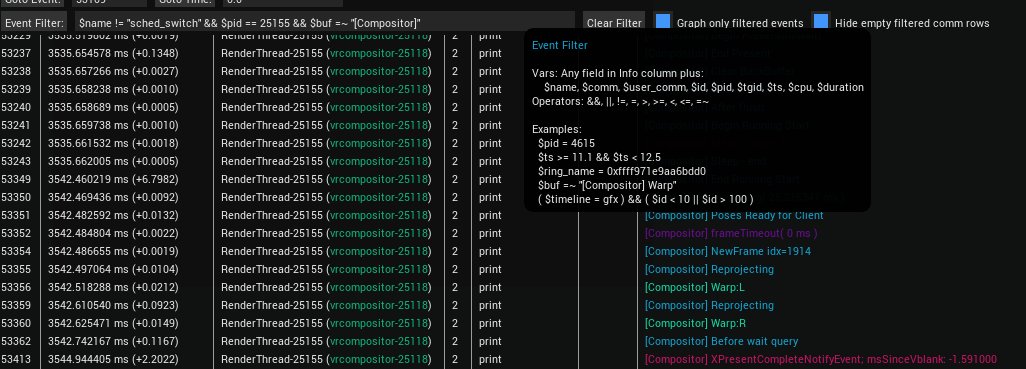
- use custom filters to view specific events
- create new graph rows
- create "graph markers" to highlight and inspect trace areas like vblank sections, etc
Right clicking on the graph, graph event, graph rows, and rows in the event list bring up context menus to:
- set markers
- save locations
- show/move/hide/add graph rows
- hide vblank events
- filter events based on event values, etc
 https://raw.githubusercontent.com/mikesart/gpuvis/master/images/gpuvis.jpg
If you are running Linux kernel v4.12+ and capture these amdgpu events:
"amdgpu:amdgpu_cs_ioctl"
"amdgpu:amdgpu_sched_run_job"
"*fence:*fence_signaled"
Gpuvis will show you stacked "SW queue", "HW queue", and "HW execution" start times and durations in the gfx timeline.

Capturing "sched:sched_switch" events allows gpuvis to graph task states:

In the above image, our mouse is hovering over the selected purple rectangle which is in the TASK_INTERRUPTIBLE state for 4.8ms. Green sections are TASK_RUNNING.
From linux/sched.h:
  TASK_RUNNING (0): On the run queue
  TASK_INTERRUPTABLE (1): Sleeping but can be woken up
  TASK_UNINTERRUPTABLE (2): Sleeping but can't be woken up by a signal
  TASK_STOPPED (4): Stopped process by job control signal or ptrace
  TASK_ZOMBIE (32): Finished but waiting for parent to call wait() to cleanup
Gpuvis shows vertical lines for vblank events if you capture "drm:drm_vblank_event", and calculate vblank queued duration if you also capture "drm:drm_vblank_event_queued" events. You can also show/hide vblanks for specific displays (crtc 0, crtc 1, etc).
 https://raw.githubusercontent.com/wiki/mikesart/gpuvis/images/gpuvis_filter.jpg