Description
I get a huge performance regression since #8328 landed (revision a8c3fe4) on all my projects. Things are 50 to 75% slower. I’m pretty sure #8328 is in cause since when I revert the compiler to the version right before (revision 67c954e) performances go back to normal.
For what it’s worth, the concerned projects are 100% generic, and rely a lot on cross-crate inlining. They do a lot of numeric computations and array indexing. Sorry if I am a bit vague but I cannot valgrind my projects because my valgrind started to segfault a few days ago (perhaps since the re-enabling of jemalloc)…
I tried to come up with a small bench exhibiting the problem. It is not that significative, but the following shows some noticeable performances regression already:
extern mod extra;

use std::hashmap;
use extra::test::BenchHarness;

#[bench]
fn bench_insert_std(bh: &mut BenchHarness) {
    let mut m = hashmap::HashMap::with_capacity(32);

    do bh.iter {
        for i in range(0u, 500) {
            m.insert((i, i), i);
        }
    }
}

#[bench]
fn bench_insert_find_remove_std(bh: &mut BenchHarness) {
    let mut m = hashmap::HashMap::with_capacity(32);

    do bh.iter {
        for i in range(0u, 200) {
            m.insert((i, i), i);
        }

        for i in range(0u, 200) {
            assert!(*m.find(&(i, i)).unwrap() == i)
        }

        for i in range(100u, 200) {
            m.remove(&(i, i));
        }

        for i in range(100u, 200) {
            assert!(m.find(&(i, i)).is_none())
        }

        for i in range(0u, 100) {
            m.insert((i, i), i * 2);
        }

        for i in range(0u, 100) {
            assert!(*m.find(&(i, i)).unwrap() == i * 2)
        }

        for i in range(0u, 100) {
            m.remove(&(i, i));
        }

        for i in range(0u, 100) {
            assert!(m.find(&(i, i)).is_none())
        }
    }
}

fn main() {
}
Compiled with --opt-level=3.
With the (new) compiler a8c3fe4, I get:
test bench_insert_find_remove_std ... bench: 89242 ns/iter (+/- 3605)
test bench_insert_std ... bench: 46177 ns/iter (+/- 1555)
With the (old) compiler 67c954e, I get something more than 10% faster. The asm dump is smaller too:
test bench_insert_find_remove_std ... bench: 73939 ns/iter (+/- 2872)
test bench_insert_std ... bench: 38482 ns/iter (+/- 1005)
Activity
alexcrichton commentedon Aug 21, 2013
LLVM may have updated their optimization passes, and we may just need to update what order we're optimizing things in. @thestinger, you mentioned loop vectorization as being a big thing at lower optimization levels, do you know of perhaps any analysis passes that we're missing by default?
alexcrichton commentedon Aug 21, 2013
After talking with @thestinger on IRC, we've reached the conclusion that one major change we can make is reworking how the LLVM passes are run. I'm not certain that this is the source of the regression you're seeing, but it's the best one that I can think of related to updating LLVM.
After looking into this, we do a large number of things differently than clang
Long story short, investigation into how we're running LLVM passes shows that it probably needs to be reworked and simplified to use more existing LLVM infrastructure and to match clang more closely. I'm still not certain that this is the cause of this regression, but I'll attempt to determine if it is by making these changes.
cc @Aatch, you were the one who recently added all the PassManager stuff to
passes.rs, just wanted to make sure that none of this is alarming to you.sebcrozet commentedon Aug 21, 2013
Thanks for all those investigations!
I merged together a few files from my project to give you a better stand-alone example of regression.
The example is big (298 lines), and mostly unreadable; but it exhibits a slowdown greater than 85% after LLVM update. I thought it might be useful for you to have an example of big slowdown for debugging.
Here is the example: https://gist.github.com/sebcrozet/6300848
Again, compiled with
--opt-level=3.With the compiler after LLVM update (revision a8c3fe4) I get:
With the compiler before LLVM update (revision 67c954e) I get:
alexcrichton commentedon Aug 23, 2013
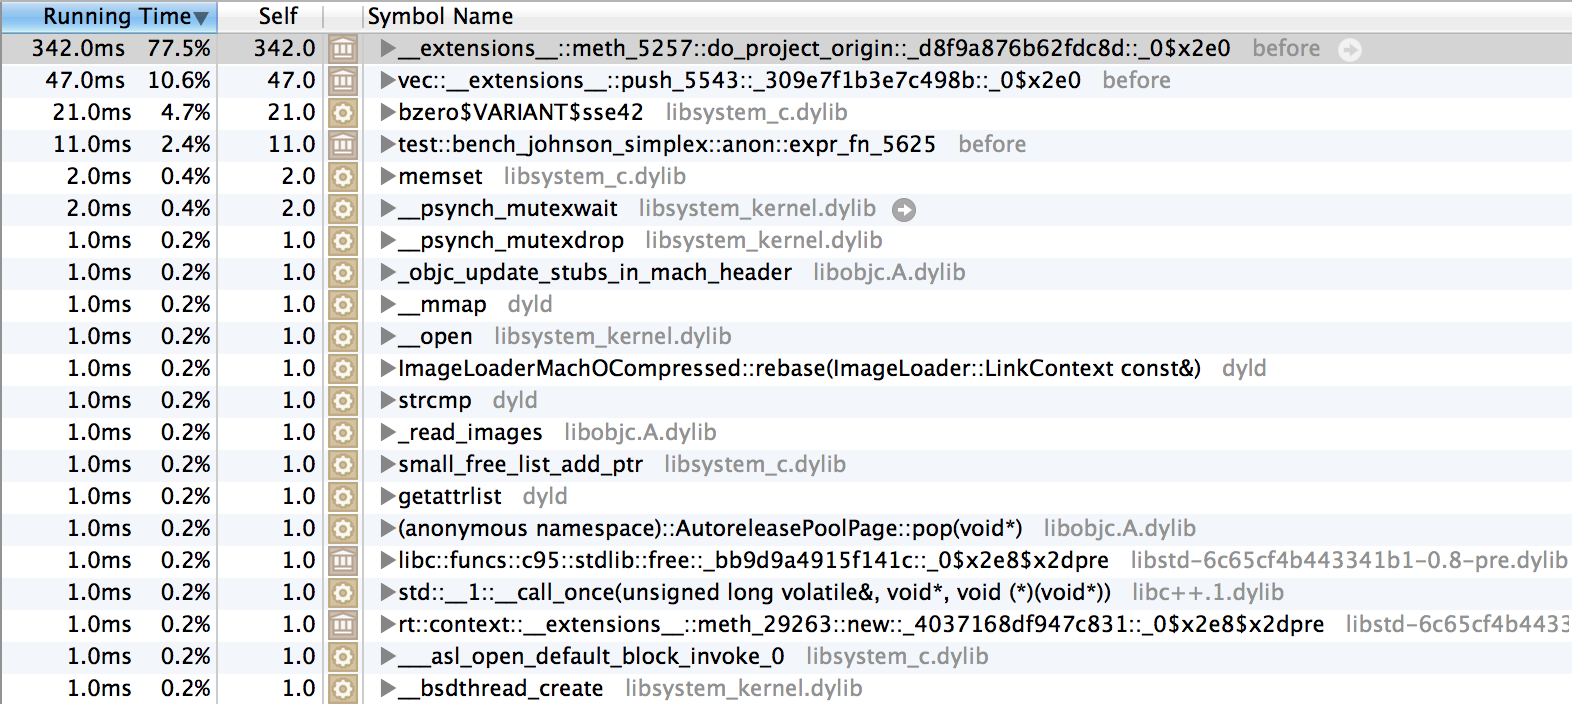
Sadly my suspicions were not correct. You're example is fantastic though, and I'm very perplexed as to what's going on with them. I did profile your code though, and I get the same 10x slowness with thew new LLVM upgrade. What's very suspicious to me are the top functions in the profile of that code. Sorry, but I haven't figured out yet how to get profiles on OSX not in instruments...
Before the llvm upgrades (stage0 today):
After #8700 (with llvm upgrades and refactored pass handling)
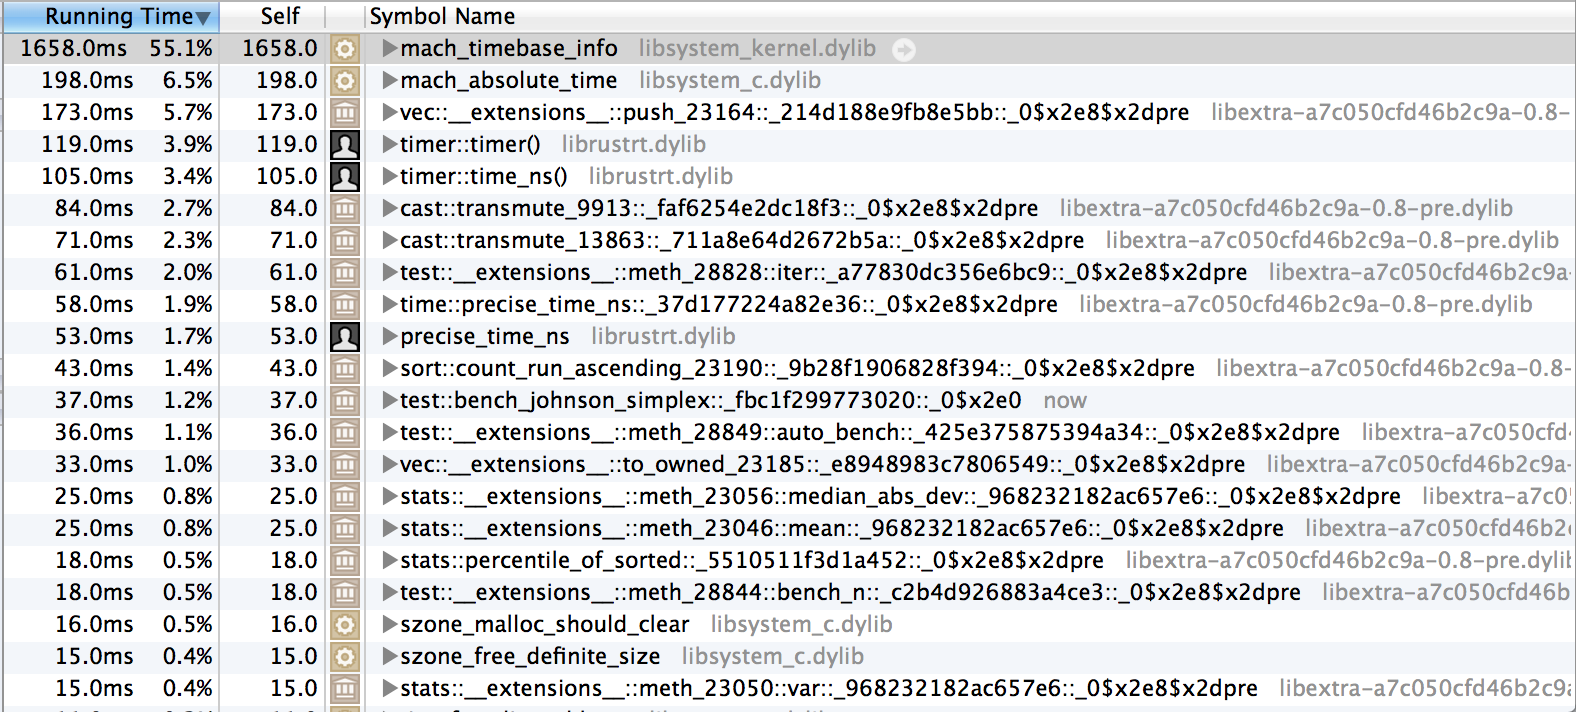
The exact test I ran was the one above, but with the iterations turned up to 1000 to take a bit longer. I'm very confused why the timing information is showing up so massively in the profiles of one, so I decided to run with different code.
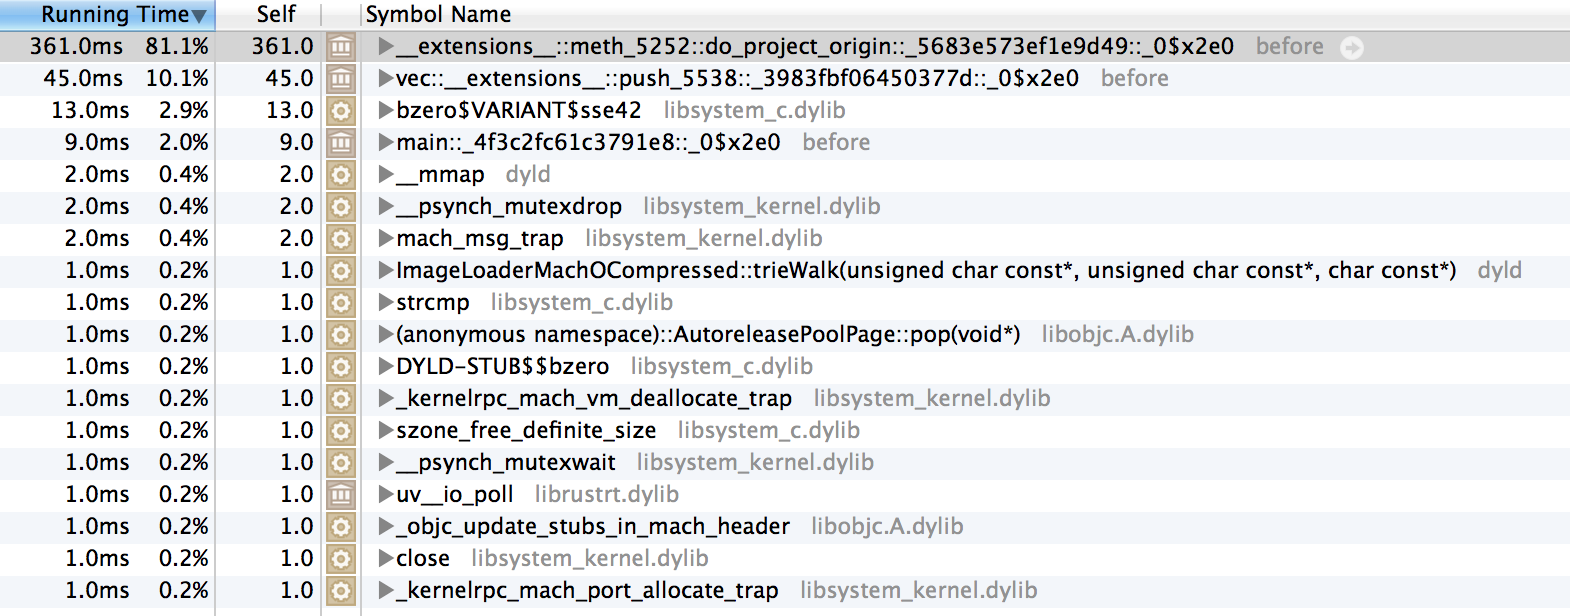
With this code, I get the following profiles
Before:
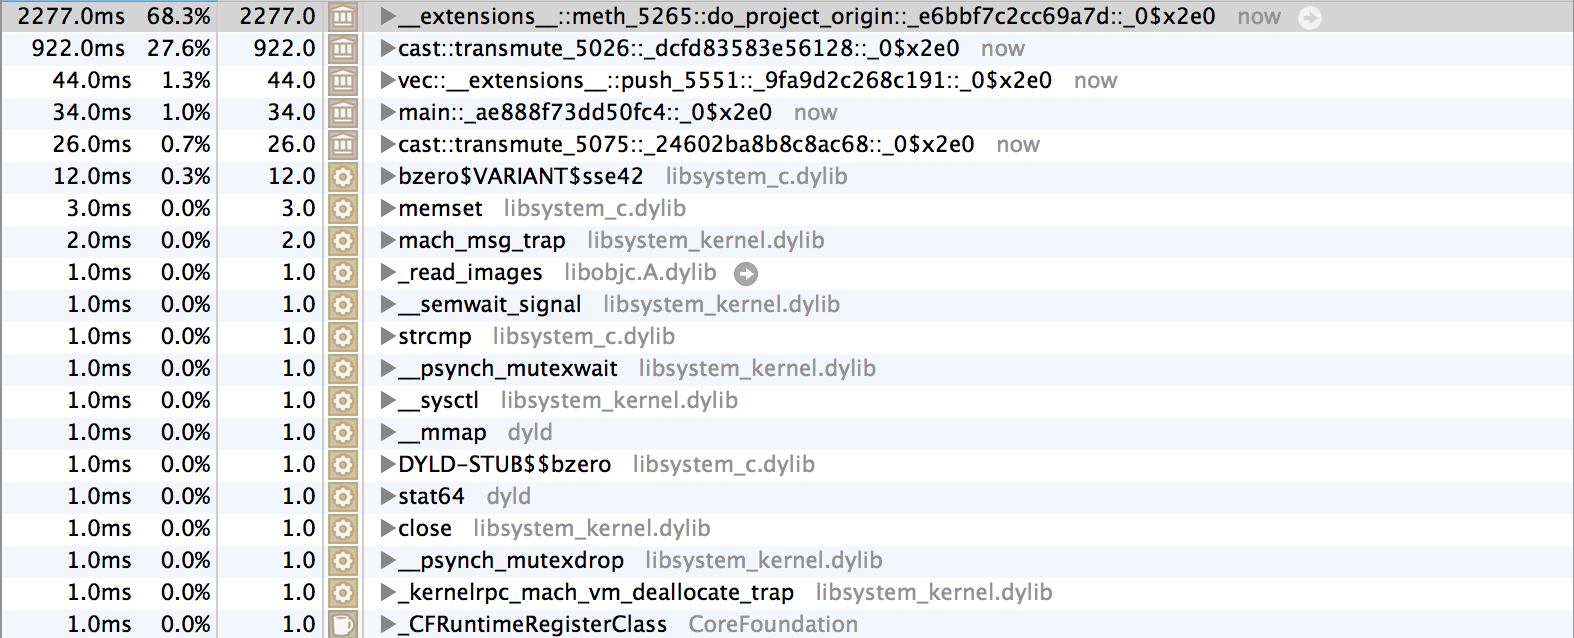
After:
I'm disturbed by the fact that there are
transmutes in the profile, but there shouldn't be any timing information weirdness going on here. I'll continue investigating later, but I wanted to post my findings here before I forgot them.graydon commentedon Aug 23, 2013
Transmute showing up means a change in inlining.
thestinger commentedon Aug 23, 2013
I identified the root cause of this issue, so I'm closing this in favour of #8720.
Auto merge of rust-lang#8665 - InfRandomness:option_take_on_temporary…