


Genai-bench is a powerful benchmark tool designed for comprehensive token-level performance evaluation of large language model (LLM) serving systems.
It provides detailed insights into model serving performance, offering both a user-friendly CLI and a live UI for real-time progress monitoring.
- 🛠️ CLI Tool: Validates user inputs and initiates benchmarks seamlessly.
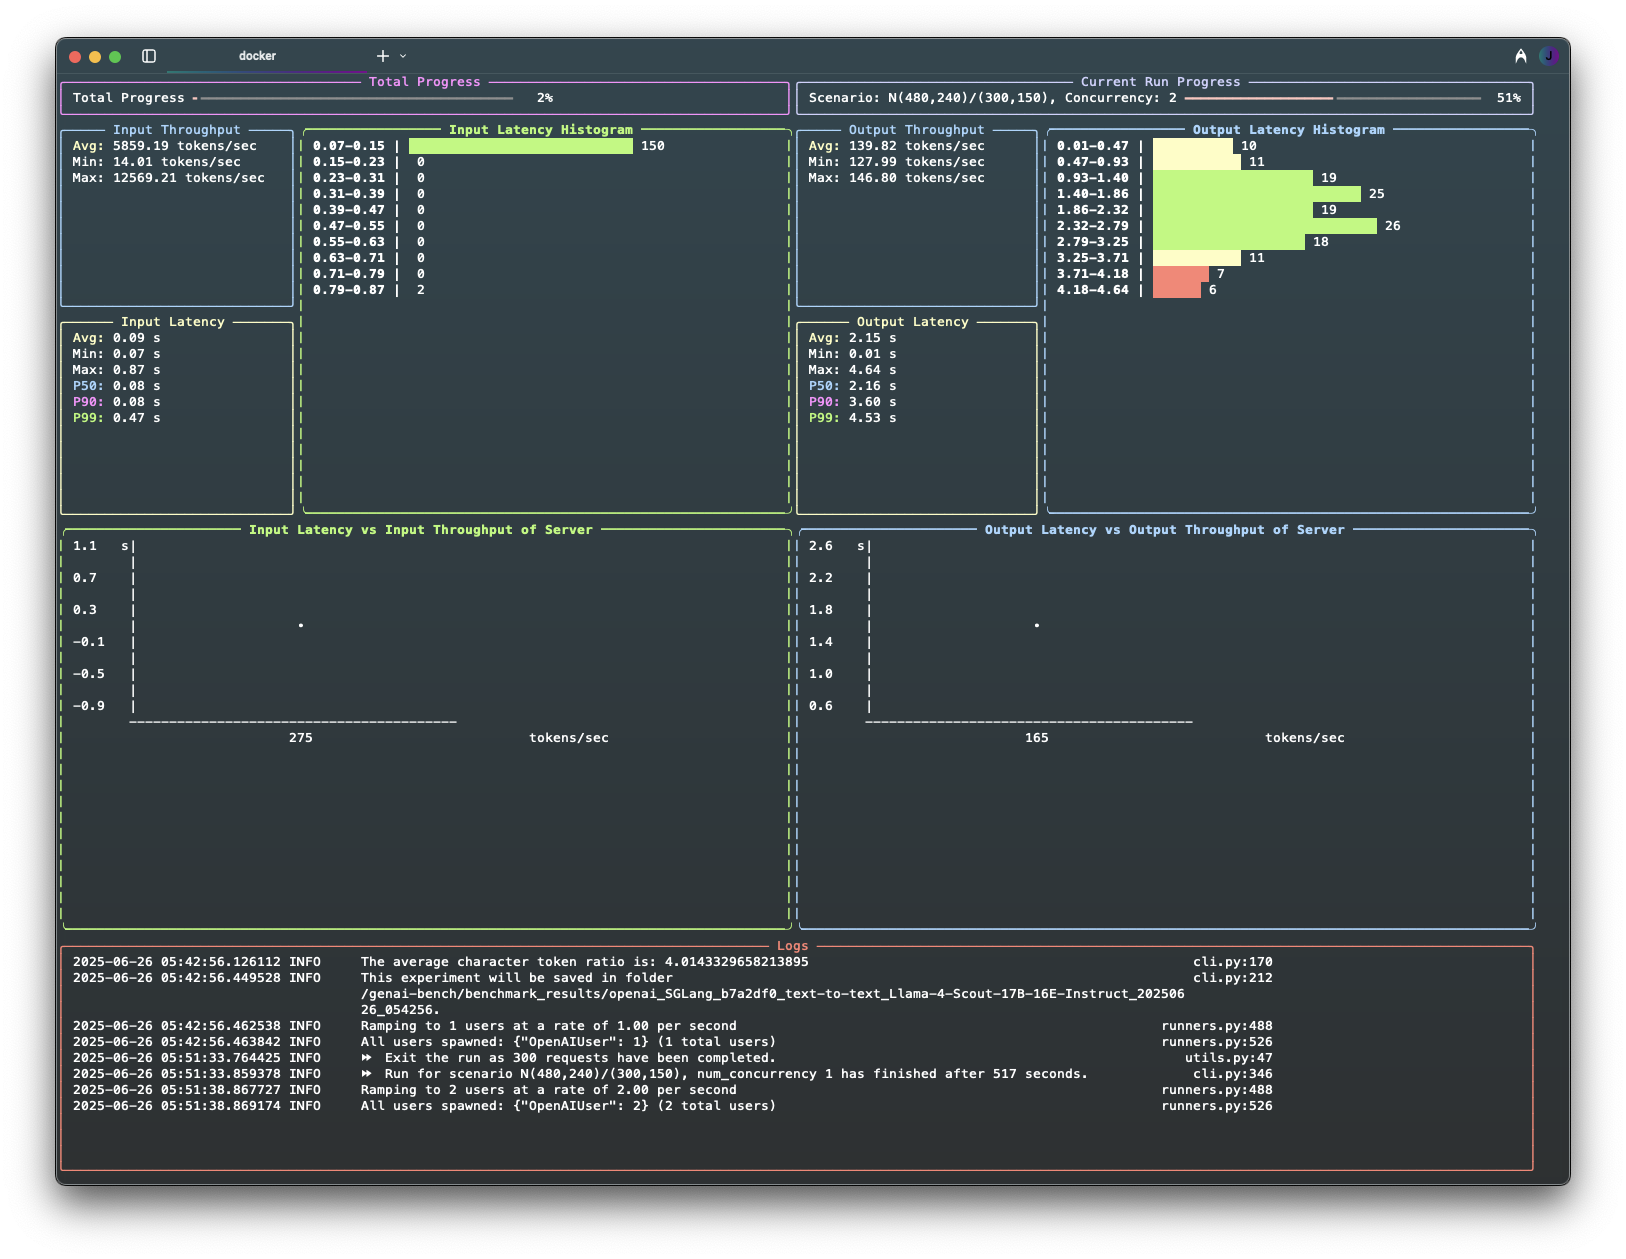
- 📊 Live UI Dashboard: Displays current progress, logs, and real-time metrics.
- 📝 Rich Logs: Automatically flushed to both terminal and file upon experiment completion.
- 📈 Experiment Analyzer: Generates comprehensive Excel reports with pricing and raw metrics data, plus flexible plot configurations (default 2x4 grid) that visualize key performance metrics including throughput, latency (TTFT, E2E, TPOT), error rates, and RPS across different traffic scenarios and concurrency levels. Supports custom plot layouts and multi-line comparisons.
Please check User Guide and CONTRIBUTING.md for how to install and use genai-bench.
This section puts together the standard metrics required for LLM serving performance analysis. We classify metrics to two types: single-request level metrics, representing the metrics collected from one request. And aggregated level metrics, summarizing the single-request metrics from one run (with specific traffic scenario and num concurrency).
NOTE:
- Each single-request metric includes standard statistics: percentile, min, max, stddev, and mean.
- The following metrics cover input, output, and end-to-end (e2e) stages. For chat tasks, all stages are relevant for evaluation. For embedding tasks, where there is no output stage, output metrics will be set to 0. For details about output metrics collection, please check out
OUTPUT_METRICS_FIELDSin metrics.py.
The following metrics capture token-level performance for a single request, providing insights into server efficiency for each individual request.
| Glossary | Meaning | Calculation Formula | Units |
|---|---|---|---|
| TTFT | Time to First Token. Initial response time when the first output token is generated. This is also known as the latency for the input (input) stage. |
ttft = time_at_first_token - start_time |
seconds |
| End-to-End Latency | End-to-End latency. This metric indicates how long it takes from submitting a query to receiving the full response, including network latencies. | e2e_latency = end_time - start_time |
seconds |
| TPOT | Time Per Output Token. The average time between two subsequent generated tokens. | TPOT = (e2e_latency - TTFT) / (num_output_tokens - 1) |
seconds |
| Output Inference Speed | The rate of how many tokens the model can generate per second for a single request. | inference_speed = 1 / TPOT |
tokens/second |
| Num of Input Tokens | Number of prompt tokens. | num_input_tokens = tokenizer.encode(prompt) |
tokens |
| Num of Output Tokens | Number of output tokens. | num_output_tokens = num_completion_tokens |
tokens |
| Num of Request Tokens | Total number of tokens processed in one request. | num_request_tokens = num_input_tokens + num_output_tokens |
tokens |
| Input Throughput | The overall throughput of input (input process). | input_throughput = num_input_tokens / TTFT |
tokens/second |
| Output Throughput | The throughput of output (output generation) for a single request. | output_throughput = (num_output_tokens - 1) / output_latency |
tokens/second |
This metrics collection summarizes the metrics relevant to a specific traffic load pattern, defined by the traffic scenario and the num of concurrency. It provides insights into server capacity and performance under pressure.
| Glossary | Meaning | Calculation Formula | Units |
|---|---|---|---|
| Mean Input Throughput | The average throughput of how many input tokens can be processed by the model in one run with multiple concurrent requests. | mean_input_throughput = sum(input_tokens_for_all_requests) / run_duration |
tokens/second |
| Mean Output Throughput | The average throughput of how many output tokens can be processed by the model in one run with multiple concurrent requests. | mean_output_throughput = sum(output_tokens_for_all_requests) / run_duration |
tokens/second |
| Total Tokens Throughput | The average throughput of how many tokens can be processed by the model, including both input and output tokens. | mean_total_tokens_throughput = all_requests["total_tokens"]["sum"] / run_duration |
tokens/second |
| Total Chars Per Hour1 | The average total characters can be processed by the model per hour. | total_chars_per_hour = total_tokens_throughput * dataset_chars_to_token_ratio * 3600 |
Characters |
| Requests Per Minute | The number of requests processed by the model per minute. | num_completed_requests_per_min = num_completed_requests / (end_time - start_time) * 60 |
Requests |
| Error Codes to Frequency | A map that shows the returned error status code to its frequency. | ||
| Error Rate | The rate of error requests over total requests. | error_rate = num_error_requests / num_requests |
|
| Num of Error Requests | The number of error requests in one load. | |
|
| Num of Completed Requests | The number of completed requests in one load. | |
|
| Num of Requests | The total number of requests processed for one load. | total_requests = num_completed_requests + num_error_requests |
Footnotes
-
Total Chars Per Hour is derived from a character-to-token ratio based on sonnet.txt and the model’s tokenizer. This metric aids in pricing decisions for an LLM serving solution. For tasks with multi-modal inputs, non-text tokens are converted to an equivalent character count using the same character-to-token ratio. ↩